
Blog
How much SBS does bitumen actually need? A walk-through of the Exaflex SBS 7090 test results
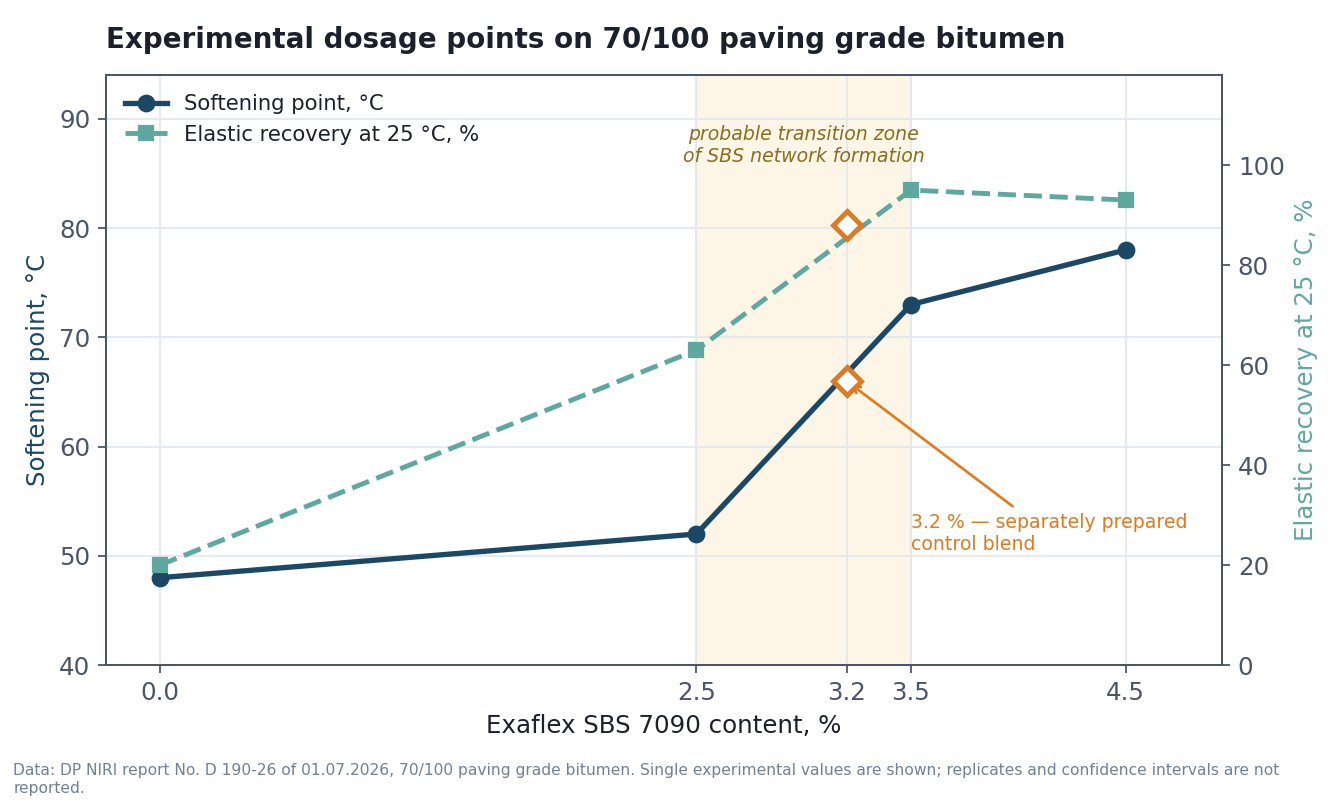
Between 2.5 % and 3.5 % polymer, the softening point of a 70/100 paving grade bitumen rose by 21 °C. Across the next interval of equal width, from 3.5 % to 4.5 %, it rose by 5 °C. Same polymer, same bitumen, same method.
That disproportion is not a quirk of one batch but typical behaviour of the bitumen–SBS system, and it is why the question "how much do I add" has no universal catalogue answer. What follows is a walk-through of real data: in June–July 2026 the polymer additive Exaflex SBS 7090 was tested at the materials testing laboratory of the State Enterprise "National Institute for Infrastructure Development" (DP NIRI, Kyiv). The report contains something rarely published — several dosage points rather than one.
A note on the limits of this article. The figures below are single measurements, without replicate blends and without confidence intervals. They reveal the character of the relationship, but they are not statistical estimates and they do not transfer to a different base bitumen.
1. The problem the polymer solves
Bitumen is a thermoplastic, which is simultaneously its greatest asset and its central defect. In summer it softens and the pavement ruts; in winter it turns brittle and cracks; under repeated loading it accumulates irreversible deformation.
The trap is that these distresses call for opposite remedies: a stiffer bitumen wins on rutting and loses on winter cracking, a softer one does the reverse. The NIRI report puts it plainly — to satisfy both requirements at once and widen the service temperature range of the binder, the physical and mechanical behaviour of the bitumen itself has to change.
Behaviour, not a number. Bitumen has a single relaxation mechanism, which locks its properties together along the temperature scale. A polymer adds a second, independent mechanism — an elastic network that neither melts at 60 °C nor vitrifies at −20 °C. That is why a modified binder can become stiffer in summer and more flexible in winter at once; an unmodified one cannot, by definition.
2. What happens when SBS enters hot bitumen
SBS is a block copolymer: two rigid polystyrene end blocks (Tg ≈ 100 °C) and a long, flexible polybutadiene mid-block (Tg ≈ −90 °C). In bulk, the polystyrene blocks assemble into domains acting as physical crosslinks — rubber without vulcanisation.
Inside bitumen the polybutadiene block absorbs maltenes, the light aromatic and naphthenic fractions, and swells several-fold in volume. The practical consequence is rarely stated out loud: 3–4 % polymer by mass occupies roughly a third of the binder by volume. You dose in percent but work with a volume fraction.
Geometry then decides. While the swollen particles remain isolated, the binder behaves like filled bitumen. Once their volume fraction crosses the percolation threshold they interlock into a continuous three-dimensional network, and at sufficient polymer content phase inversion follows: the polymer-rich phase becomes the continuous one. The rheology changes qualitatively — an elastic response appears and the complex modulus rises.
That is a mechanism described in the literature, not a measurement made in this study. Classical binder tests cannot establish at what content inversion occurred; that requires fluorescence microscopy, DSR, or other morphological and rheological methods.
The practical conclusion is therefore this: the effective dose is set by the compatibility of the specific "base bitumen + SBS" pair and by the preparation regime. Bitumen composition is critical — swelling feeds on its maltene fraction, and the dependence of compatibility and storage stability on SARA fractions was documented by Lu and Isacsson. But polymer architecture, molecular weight, diblock content, temperature, time and shear intensity influence the outcome just as much.
3. Experimental dosage points on 70/100 bitumen
The neat bitumen and three dosages — 2.5 %, 3.5 % and 4.5 % — were tested. The polymer was introduced into bitumen heated to 175–185 °C under continuous mechanical stirring, with a stirring time of 3.0 hours.
Table 1. Dosage selection results (NIRI report No. D 190-26, Table 2)
| Property | 0 % | 2.5 % | 3.5 % | 4.5 % |
|---|---|---|---|---|
| Penetration at 25 °C, 0.1 mm | 78 | 58 | 49 | 47 |
| Softening point (R&B), °C | 48 | 52 | 73 | 78 |
| Fraass breaking point, °C | −18 | −19 | −21 | −24 |
| Elastic recovery at 25 °C, % | 20 | 63 | 95 | 93 |
The report names this property "elasticity"; it is elastic recovery determined to EN 13398.
The most informative view is the average gain per additional percentage point of polymer within each interval.
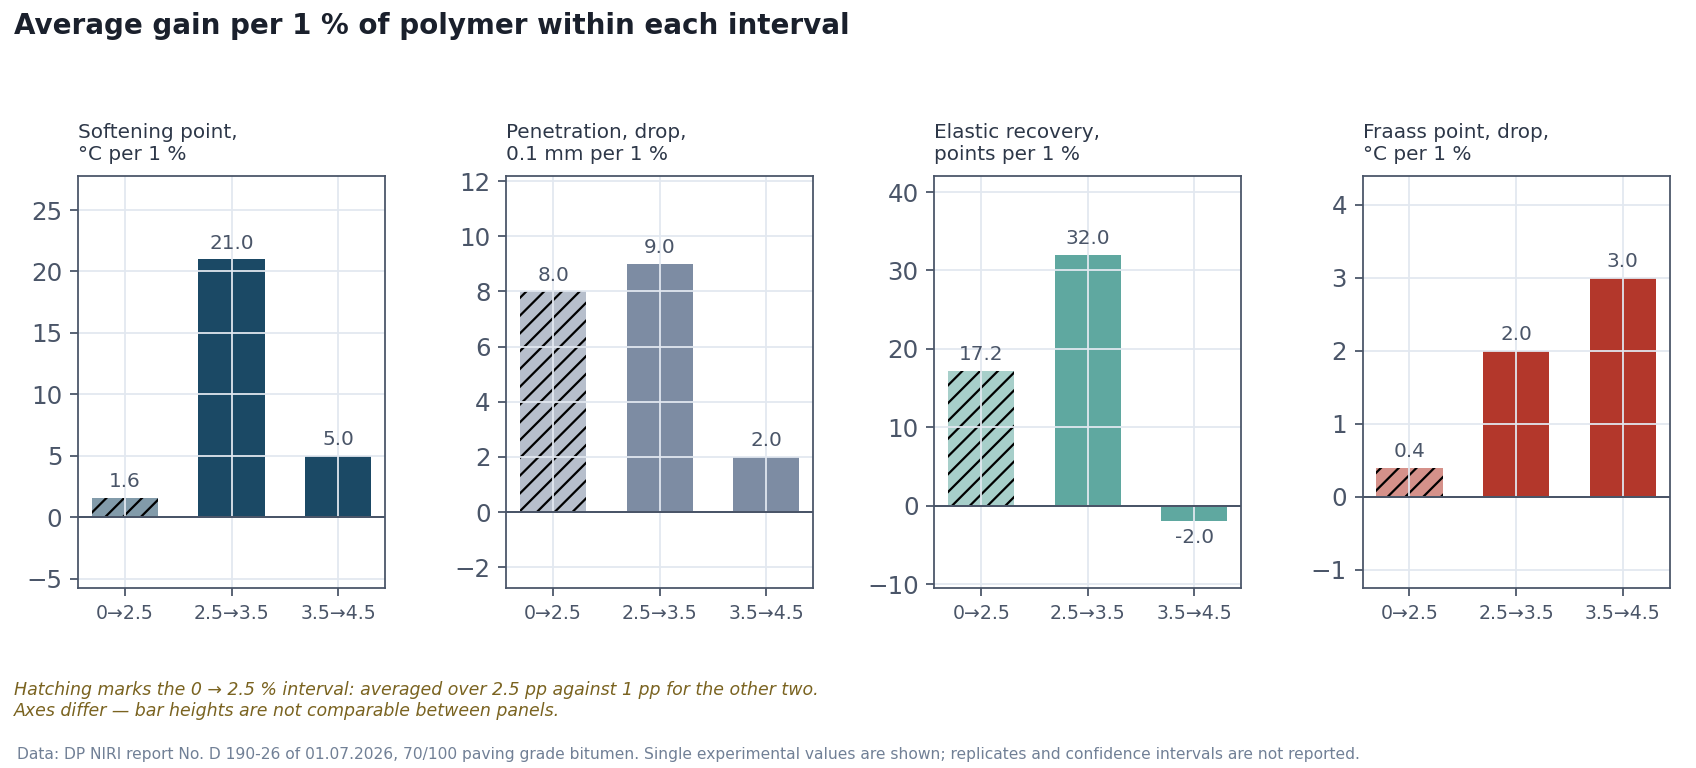
Only the last two intervals may be compared with one another: both are 1 pp wide. The 0 → 2.5 % interval is averaged over 2.5 pp with no intermediate points, so its height is not comparable with the rest.
- 2.5 → 3.5 %. One percentage point of polymer buys +21 °C of softening point and +32 points of elastic recovery.
- 3.5 → 4.5 %. The same percentage point buys +5 °C and minus 2 points.
A fourfold difference in softening point gain between adjacent intervals of equal width is the central practical fact of the dataset. It is consistent with a transition to a developed SBS network somewhere in the 2.5–3.5 % range: the return on each percentage point rises sharply, then falls just as sharply. The transition point cannot be located from these tests, and the drop in elastic recovery from 95 % to 93 % should not be read as a real decline either — without repeatability data such a difference proves nothing.
On the Fraass breaking point specifically. The values fall monotonically from −18 °C to −24 °C, and the temptation to build a separate cold-climate dosing strategy on that is considerable. It should be resisted: EN 12593 states a repeatability r of 3 °C and a reproducibility R of 6 °C, so the step between adjacent points (1–3 °C) sits entirely within the precision of the method. Only the overall 6 °C span between the neat binder and 4.5 % carries meaning, and even that is at the limit of repeatability.
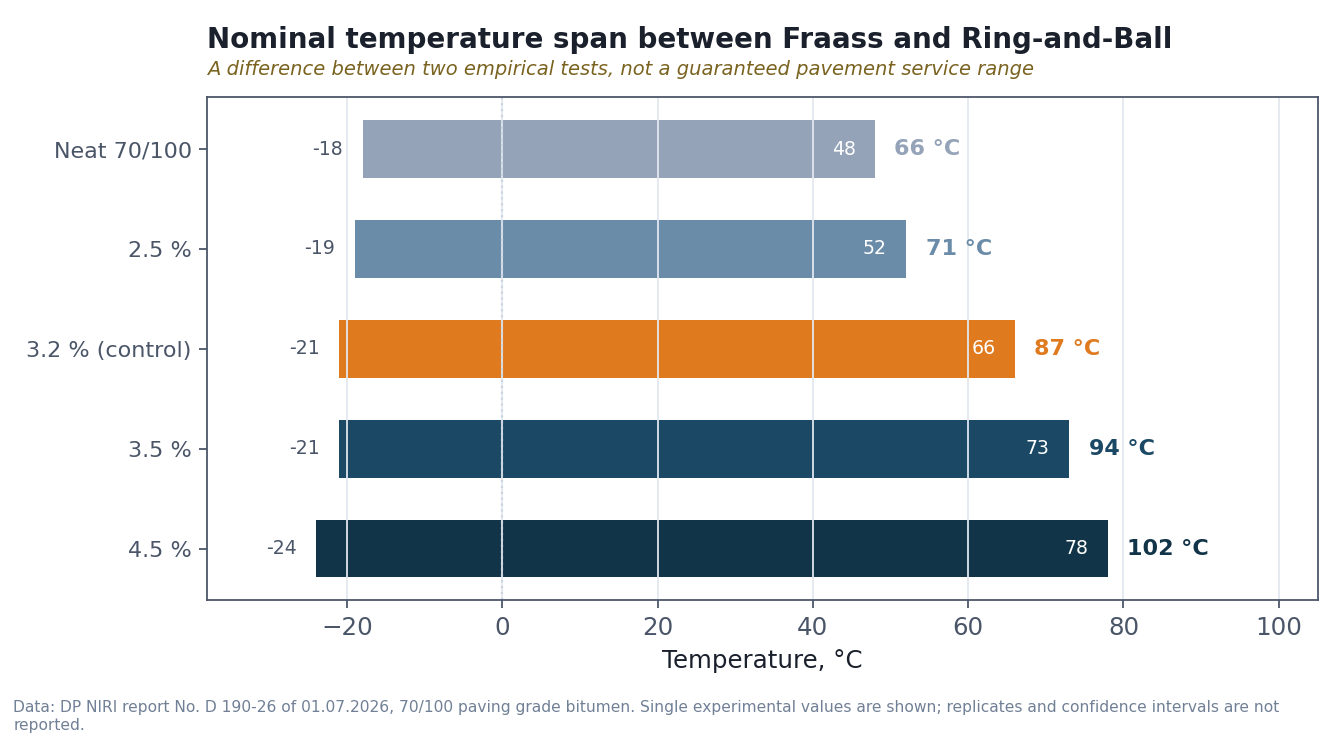
The span between the Fraass point and the softening point is called the plasticity range in the report; it widens from 66 °C in the neat bitumen to 102 °C at 4.5 % polymer. It is worth remembering that this is a difference between two empirical test results, not a guaranteed pavement service range.
4. Why 3.2 % was chosen for the control blend rather than 3.5 %
Peak elastic recovery — 95 % — occurs at 3.5 %. For further work and practical implementation the report adopts 3.2 %, describing it as the optimum content.
Table 2. 70/100 bitumen modified with 3.2 % Exaflex SBS 7090 (Table 3 of the report)
| Property | Neat | 3.2 % additive | Class per DSTU EN 14023:2023 |
|---|---|---|---|
| Penetration at 25 °C, 0.1 mm | 78 | 52 | 4 (45 to 80) |
| Softening point (R&B), °C | 48 | 66 | 5 (≥ 65) |
| Fraass breaking point, °C | −18 | −21 | 9 (≤ −20) |
| Elastic recovery at 25 °C, % | 20 | 88 | 2 (≥ 80) |
| Flash point, °C | 325 | 340 | 2 (≥ 250) |
| Retained penetration, % | 68 | 85 | 7 (≥ 60) |
| Increase in softening point, °C | 4.8 | 1.8 | 2 (≤ 8) |
| Change of mass, % | 0.6 | 0.3 | 2 (≤ 0.3) |
The 3.2 % blend was prepared separately and the result sits on the trend between 2.5 % and 3.5 %: linear interpolation predicts 66.7 °C against 66 °C measured, and 85 % elastic recovery against 88 % measured. This indicates internal consistency of the dataset. It is not an estimate of reproducibility — that would require replicate blends and reported scatter.
The report frames the case against 3.5 % as technical and economic expediency, and three things sit behind it.
Viscosity. Once a developed polymer phase has formed, viscosity grows faster than in proportion to dose. Every additional tenth of a percent costs more at the pumps, the mixer and the rollers, and an excessively viscous binder coats aggregate less well and compacts worse — part of the laboratory gain is lost on site.
Phase separation risk. The higher the polymer fraction, the stronger the driving force separating polymer-rich from asphaltene-rich phases under prolonged hot storage. The report gives this argument; note, however, that the storage stability of this blend was not verified to EN 13399 within the study, so a lower concentration here plausibly reduces the process risk rather than demonstrably reducing it.
The specification demands a class, not a record. PMB 45/80-65 requires a softening point ≥ 65 °C and elastic recovery ≥ 80 %. At 3.2 % the results are 66 °C and 88 %; the additional 7 points of recovery at 3.5 % buy no further compliance, only further consumption.
Now the margin, and this is the most important paragraph in the article. On softening point it is 1 °C — 66 against a limit of 65. On change of mass there is none at all: 0.3 % against a class limit of ≤ 0.3 %. The 3.2 % figure is not a portable recipe but the outcome of a dosage study on one specific bitumen, with minimal specification headroom. Whether it was the minimum sufficient dose is unknown: 3.0 % and 3.1 % were not tested. You will have to run your own study regardless — the value of this data is that it shows the character of the curve and the range worth starting from.
5. What the short-term ageing tests showed
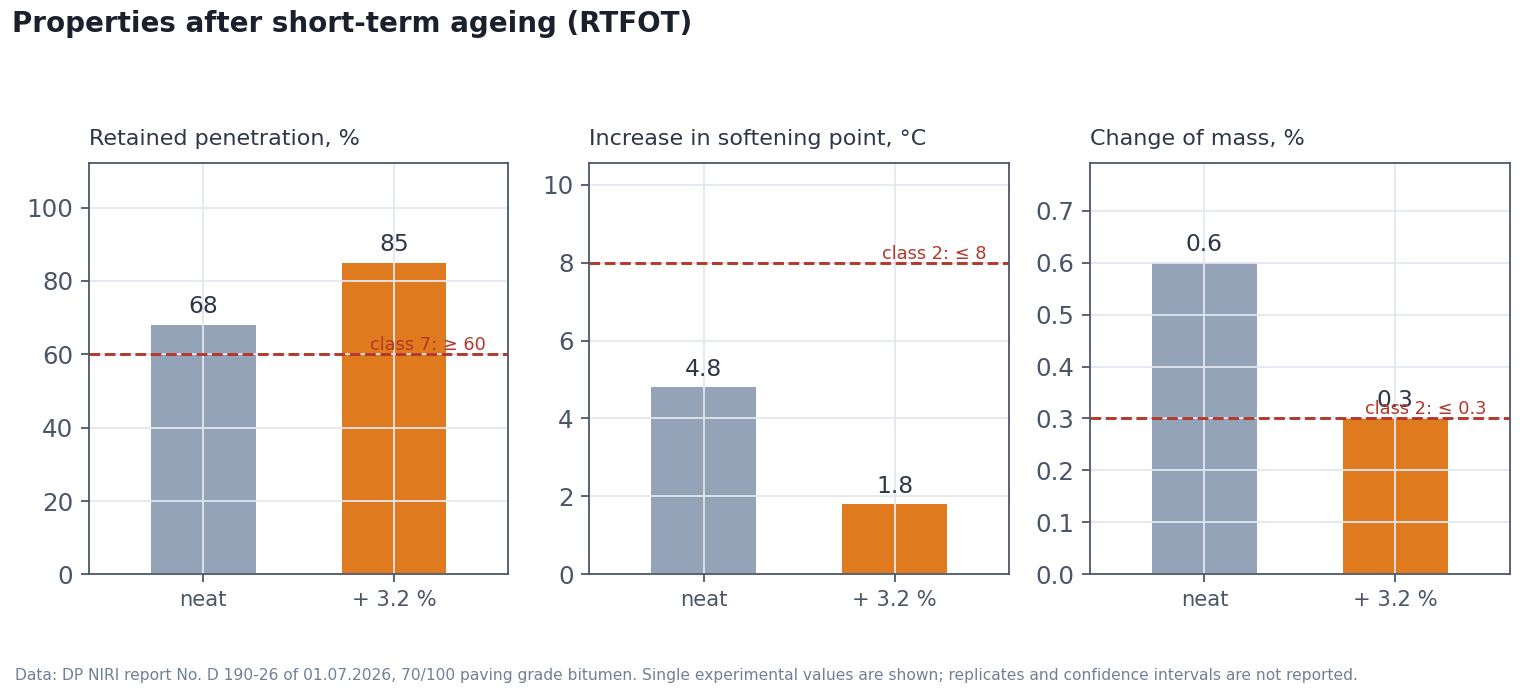
After RTFOT the modified binder showed a smaller relative change in properties than the neat binder: retained penetration 85 % against 68 %, increase in softening point 1.8 °C against 4.8 °C, change of mass 0.3 % against 0.6 %.
Why this occurred cannot be established from the available protocol. Penetration, softening point and change of mass do not allow the contributions of the polymer network, oxidation of the bitumen matrix and degradation of the SBS itself to be separated. Distinguishing those processes requires chemical (FTIR), molecular (GPC) or rheological methods.
Points worth bearing in mind when reading these numbers:
- Retained penetration is a relative metric. A binder starting at 52 and a binder starting at 78 change on different parts of the scale, so comparing their percentages directly is not a valid comparison of oxidation resistance.
- SBS in bitumen does degrade. Thermal-oxidative ageing studies describe a two-stage picture: crosslinking of polymer chains dominates first, and after longer thermal exposure chain scission takes over, visible as a reversal in the polydispersity index and a fall in molecular weight. The double bonds and α-hydrogen of the polybutadiene block oxidise to hydroxyl and carboxyl groups.
- RTFOT models short-term ageing only — 85 minutes at 163 °C, that is, mixing and laydown. It says nothing about a tank held for days at high temperature without agitation, nor about long-term ageing in the pavement; that is what PAV is for, and PAV was not performed.
The working rules that follow are simple: do not exceed the working temperature, do not store finished PMB hot for long periods, keep it agitated.
6. What penetration and ring-and-ball cannot see
The classical tests were designed for unmodified bitumen, and applied to PMB they have a blind spot every binder acceptance engineer should know about.
Penetration and softening point cannot distinguish an elastic network from simple thickening. The same 65 °C ring-and-ball can be reached with air-blown bitumen, wax, excess filler, or a polymer with high diblock content. The certificate will be compliant; the elastic response will be absent — and on the road that surfaces as rutting and fatigue cracking within a season or two.
Among the classical tests the most informative here is elastic recovery to EN 13398. The rise from 20 % to 88 % is a strong practical indicator of elastomeric response, although the method by itself does not confirm the morphology of the polymer phase. In the pair "softening point + elastic recovery" it is the second figure that says something about the nature of the modification; the first only says the binder got stiffer.
The Fraass breaking point has well-documented limitations. Beyond the precision noted above, correlation between asphalt mixture fracture temperature and the Fraass point is weak (R² ≈ 0.50), whereas correlation with BBR limiting temperatures is strong (R² > 0.80). Fraass is also run on unaged binder. So −21 °C is a specification requirement met, not a prediction of winter performance.
For a high-consequence project, supplement the specification set with MSCR (Jnr and percent recovery) for rutting resistance and BBR for low temperatures. MSCR is not omnipotent either — in some studies it failed to distinguish 5.0 % from 5.5 % SBS — but it does show behaviour under repeated loading.
7. Linear versus radial SBS, and what diblock is for
Exaflex SBS 7090 is a linear S-B-S with a nominal butadiene/styrene ratio of ≈ 70/30 and diblock content of 15–18 %.
Architecture. Linear grades give lower solution viscosity at equal molecular weight, so they disperse more easily and load equipment less. Radial grades give higher viscosity and, per several datasets, better fatigue resistance. An often-ignored detail: at low dosages the difference between architectures is small and becomes pronounced mainly at high dosages. In comparative work at 6 % SBS, the linear grade showed slightly higher recovery and lower permanent deformation than the radial one. In the 3–4 % band actually used for PMB 45/80-65, architecture is not the governing factor.
Diblock. Diblock (S-B) carries only one polystyrene end and therefore bears no load within the network. In terms of network strength it is ballast; in terms of processing it is the opposite — it acts as a compatibiliser, lowers viscosity, accelerates swelling and eases dispersion. A content of 15–18 % is a trade toward processability, and the results at 3.2 % show the network still forms sufficiently to meet the class requirements.
A protocol detail. The description of the process records mechanical stirring for 3.0 hours; no colloid mill or other high-shear equipment is mentioned. This does not prove a low-shear route was used — the description is brief — but a producer weighing the purchase of a mill against selecting a polymer to suit existing equipment should request the full protocol.
On the market. You will encounter Kraton D1101 and D1192, Dynasol Calprene, Sinopec YH-791/792 grades and LG products. Comparing datasheets has limited value: none of these polymers has a dose of its own. The dose belongs to the pair "polymer + your base bitumen", and switching between any two grades means repeating the study.
8. Production practice
175–185 °C is the regime used in the tests. Below it, swelling is slower and undissolved particles may remain; raising the temperature beyond the normal working range increases the risk of thermal-oxidative degradation of the polymer. The specific threshold at which degradation becomes governing depends on the bitumen–SBS pair and was not established in this work.
3.0 hours of stirring is not mixing time but development time — swelling and network formation. Cutting it short leaves an immature system whose properties will still shift in the tank; extending it excessively carries degradation risk. The optimum duration for a different pair of materials must be determined separately.
Delivery form. Powder swells faster thanks to higher specific surface area. Granules are dust-free and easier to dose. A non-obvious trap for mill owners: excessive pre-swelling reduces the milling effect, so on a high-shear route the premix should be short — just enough for initial dispersion.
Run an EN 13399 storage stability test before series production. This is a three-day test on one prepared specimen: the tube is held vertically at 180 °C for 72 h, then cooled, divided into three parts, and the top and bottom sections compared by penetration and softening point. The cost of skipping it is a tank of separated binder.
Base bitumen. If the refinery can supply SARA data, take it. High asphaltene content and poor aromaticity signal that the dose will have to rise and stability will be worse.
9. What it delivers on the road, and how it looks economically
The cleanest available field data come from the Minnesota DOT study. It compared a specific pair: modified PG 58H-34 against unmodified PG 58S-28 on low-volume roads. In that scenario the polymer-modified binder gave a calculated service life extension of six years and about 14.4 % life-cycle cost savings despite the higher initial price. That is the result of one specific comparison, not a universal effect of any PMB.
A lab-to-field gap exists and is documented: some reviews report laboratory models predicting service life gains above 10 years while field observations returned less than 3. The reason is not that polymer fails to work, but that the outcome is determined by a chain — dose, base bitumen, mix design, laydown temperature, compaction — and any link can consume the gain.
On polymer consumption the arithmetic is straightforward: 4.5 % is 45 kg per tonne of binder, 3.2 % is 32 kg, a difference of 13 kg/t or about 29 %. An important caveat: 4.5 % here is the upper experimental point, not anyone's actual production formulation, so this compares trial dosages rather than demonstrating a specific plant's savings. It does set the direction, though: dose is the one lever a plant controls directly, and running a study on your own bitumen instead of adding a safety margin removes an overpayment for properties no specification asks of you.
10. What is confirmed — and what is not
Confirmed by DP NIRI report No. D 190-26 (approved 01.07.2026, contract No. 190-26 of 05.06.2026):
- Exaflex SBS 7090 can be used for bitumen modification;
- 70/100 paving grade bitumen to DSTU 4044:2019, modified with 3.2 % of the additive, complies with DSTU EN 14023:2023 at the classes listed in Table 3;
- the same binder complies with DSTU 9281:2024 for grades PMB 45/80-60 and PMB 45/80-65.
Table 3. Confirmed classes per DSTU EN 14023:2023
| Property | Class | Class requirement | Measured |
|---|---|---|---|
| Penetration at 25 °C, 0.1 mm | 4 | 45 to 80 | 52 |
| Softening point, °C | 5 | ≥ 65 | 66 |
| Fraass breaking point, °C | 9 | ≤ −20 | −21 |
| Elastic recovery at 25 °C, % | 2 | ≥ 80 | 88 |
| Flash point, °C | 2 | ≥ 250 | 340 |
| Retained penetration, % | 7 | ≥ 60 | 85 |
| Increase in softening point, °C | 2 | ≤ 8 | 1.8 |
| Change of mass, % | 2 | ≤ 0.3 | 0.3 |
Not covered by this report:
- other base bitumens — 50/70, 35/50;
- PMB grades other than 45/80-60 and 45/80-65;
- mixture-level testing;
- long-term PAV ageing;
- storage stability to EN 13399;
- MSCR, BBR, viscosity measurement;
- replicate blends and scatter estimates;
- morphology of the modified binder.
11. A practical sequence
- Record the certificate of your own base bitumen — everything downstream is anchored to it.
- Order a polymer sample; 1–5 kg is enough for a laboratory study.
- Run three points, not one — the target dose, minus 0.5 % and plus 0.5 %.
- Measure elastic recovery to EN 13398, not just penetration and softening point.
- Run an EN 13399 test at the selected dose before series production.
- Fix the process regime — temperature, time, order of addition — and hold to it.
Exaflex® SBS 7090 — linear SBS for the production of polymer-modified bitumen. Samples of 1–5 kg for laboratory testing are supplied free of charge. Every batch ships with a certificate of analysis. Technical support on dosage selection for your base bitumen: +38 050 323-23-21.
Technical data and supply terms for Exaflex® SBS 7090 →